protests module
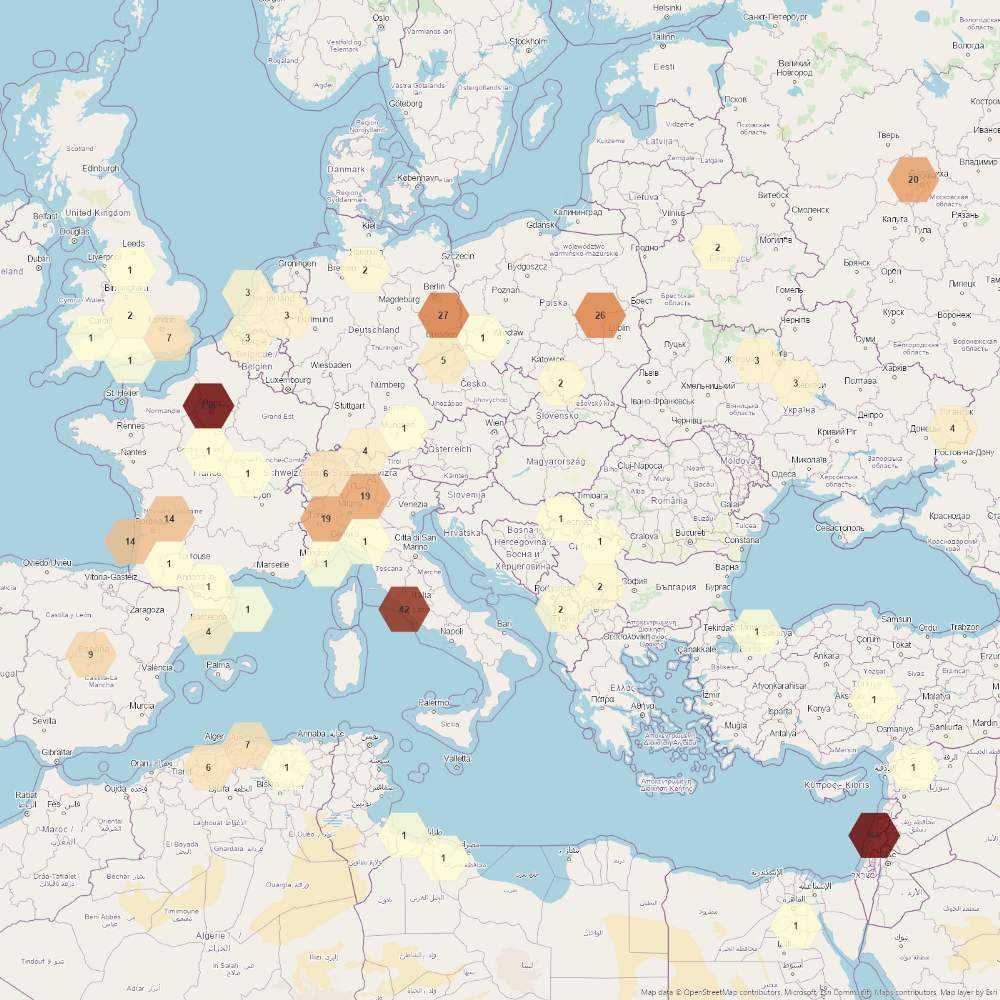
Query broadcasted events worldwide and visualize them using spatial aggregations. The service filters thousands of online news sources of the last 24 hours mentioning occurred protests or demonstrations. We constructed a web mercator spatial grid having a grid size being optimized for geographic visualization. Each grid cell is enriched with a count attribute representing the number of news article related to locations of the corresponding grid cell.
The service uses the impressive data source provided by the Global Database of Events, Language and Tone (GDELT) Project. The service aggregates locations where some kind of protest took place using geospatial intelligence operations. The geospatial results support the GeoJSON and Esri Features format out of the box.
Every geospatial result support the GeoJSON and Esri FeatureSet format out of the box. All endpoints support an optional date parameter for filtering the results. For best performance, the serverless cloud-backend calculate the geospatial aggregations of the last 24 hours between midnight and 1 AM UTC. The serverless functions save these geospatial features since November 19, 2021 and yesterday should be the latest available date. Without specifying a date, we have to calculate the geospatial features of the last 24 hours on-the-fly.
For example:
>>> from georapid.client import GeoRapidClient
>>> from georapid.factory import EnvironmentClientFactory
>>> from georapid.protests import articles
>>> host = "geoprotests.p.rapidapi.com"
>>> client: GeoRapidClient = EnvironmentClientFactory.create_client_with_host(host)
>>> articles = articles(client)
- georapid.protests.aggregate(client: GeoRapidClient, date: datetime | None = None, format=OutFormat.GEOJSON)
Aggregates the broadcasted news related to protests/demonstrations using a spatial grid and returns the features as hexagonal bins. The date is optional. When not specified, we return the features of the last 24 hours. The underlying hosted feature service saves these features since November 19, 2021 and yesterday should be the latest available date. The format can be GeoJSON or Esri JSON.
- georapid.protests.articles(client: GeoRapidClient, date: datetime | None = None)
Returns a list of broadcasted articles related to protests/demonstrations. The date is optional. When not specified, we return the articles of the last 24 hours. The underlying web service saves these articles since November 19, 2021 and yesterday should be the latest available date.
- georapid.protests.hotspots(client: GeoRapidClient, date: datetime | None = None, format=OutFormat.GEOJSON)
Returns the hotspot locations related to protests/demonstrations. The date is optional. When not specified, we return the features of the last 24 hours. The underlying hosted feature service saves these features since November 19, 2021 and yesterday should be the latest available date. The format can be GeoJSON or Esri JSON.